
Featured Case Study:
Auto Manufacturer Isolates Critical Risk With Sayari Map
Table of Contents
Executive Summary
Pressure to screen supply chains for sustainability and human rights risk has reached an all-time high. Geopolitical tensions have sparked a wave of regulations, starting with the U.S. Uyghur Forced Labor Prevention Act (UFLPA) and expanding to Europe’s Corporate Sustainability Due Diligence Directive (CSDDD), German Supply Chain Due Diligence Act (LkSG), and the proposed European Union (EU) Forced Labour Regulation. Climate initiatives, such as the EU Regulation on Deforestation-free Products (EUDR), are also reshaping procurement policies.
Navigating this increasingly complex international compliance landscape poses a daunting set of challenges to corporate supply chain and procurement teams, particularly those with tens of thousands of direct and sub-tier suppliers. Because non-compliance carries significant financial and reputational risks, teams must prioritize resources on high-impact suppliers. Often, the sheer scale of this task leaves teams under-resourced and vulnerable.
Automated supply chain risk detection platforms now help companies keep pace by providing instant, highly relevant insight into supplier risk. This enables procurement teams to efficiently prioritize suppliers by risk type, geography, or HS code before sending supplier questionnaires. Platforms like Sayari empower supply chain risk management teams to optimize compliance at scale.
A New Supply Chain Risk Paradigm
The UFLPA, widely considered the most restrictive supply chain regulation today, raises the stakes for non-compliance in two key ways:
- Importers are increasingly responsible for their entire supply chains. By establishing a prohibition on goods made wholly or in part with forced labor, the UFLPA requires importers to vet supply chains down to the raw material. Compliance teams must evaluate direct suppliers based not only on their own risk, but also on their upstream or sub-tier risk. This level of due diligence remains a challenge for most companies. In a 2022 survey by McKinsey, only 17% of supply chain leaders claimed visibility down to the third tier and beyond, highlighting a resource gap.
- Enforcement can have an outsized impact on revenue. If U.S. Customs and Border Protection (CBP) suspects non-compliance, it will issue a Withhold Release Order (WRO) to detain the entire shipment — not just the good in question. A single non-compliant product can freeze vast amounts of inventory, increasing the pressure to identify high-priority risks.
Newer regulations are already beginning to take cues from the UFLPA. The CSDDD requires covered entities to conduct due diligence not only on their own operations but also on those of their subsidiaries and other entities within their direct and indirect business relationships.
While its enforcement differs from that of the U.S. law, the proposed EU Forced Labor Regulation similarly bans products made with forced labor from EU markets. It follows that one non-compliant component could render an entire product inadmissible.
As deep visibility becomes the status quo, compliance teams face higher stakes. Manual supplier prioritization workflows are ill-equipped for this new regulatory regime. Automation allows companies to gain deeper visibility faster and with fewer resources.

“Previously, evaluating suppliers for compliance and supply chain risks was a labor-intensive process that involved sifting through numerous disparate sources to manually configure the risk landscape. Now, it can be done in just minutes, allowing us to better advise based on a clear view of a supplier’s situation and risk exposure.”
How It Works
Sayari Map automatically creates high-probability maps of supply chains, scans for relevant risk, and presents accessible, actionable results. Organizations using automated risk detection catch more critical vulnerabilities than those that do not — and in mere seconds.
Sayari Map Accelerates Risk Detection
Unlike supplier testimony, which references only internal data, Sayari Map uses external corporate, trade, and risk data to map supply chains from the outside in.
Sayari’s corporate database contains profiles on nearly 600 million companies and more than 660 million key individuals across 250+ jurisdictions worldwide. Its trade database is more geographically comprehensive than any other on the market, and its risk insights go far beyond watchlisted entities to include a vast array of non-obvious risk types.
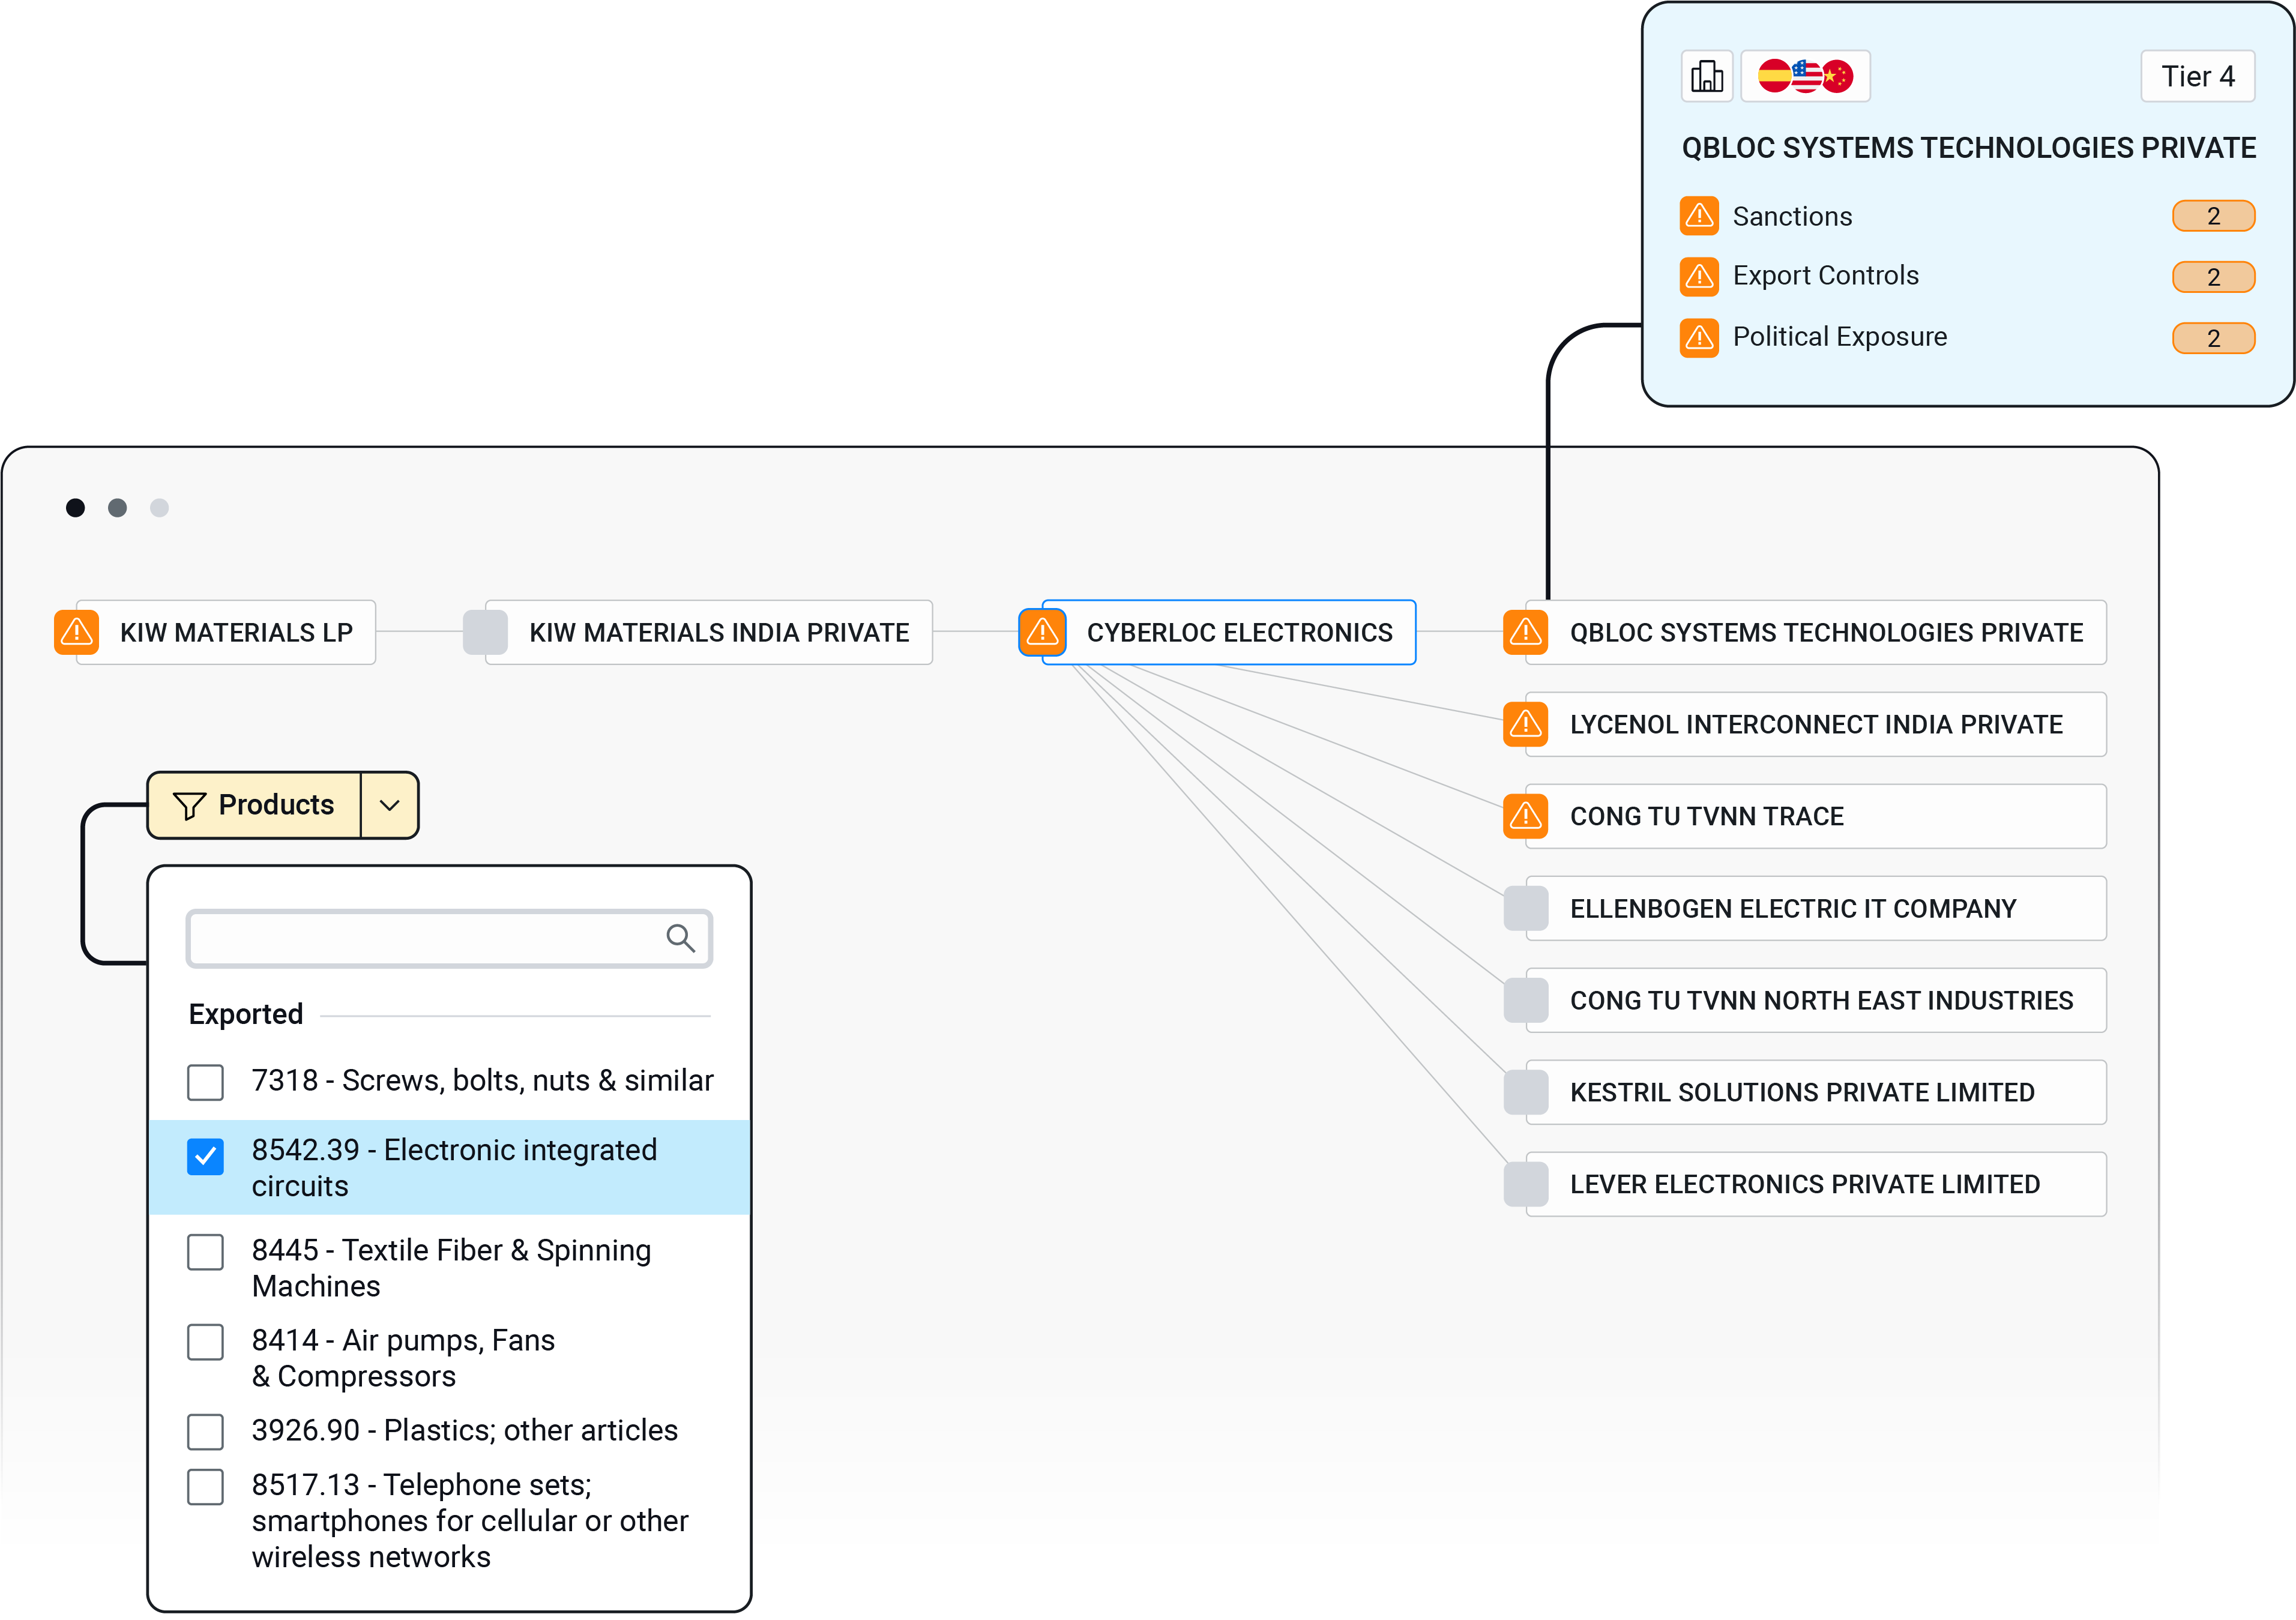
By matching their supplier lists against Sayari’s comprehensive database, organizations can instantly generate highly relevant, highly filterable supply chain maps tracking 100+ risk indicators n-tiers deep. Each entity in the map links to an entity profile complete with court-admissible records substantiating the risk source (See Fig. 1).
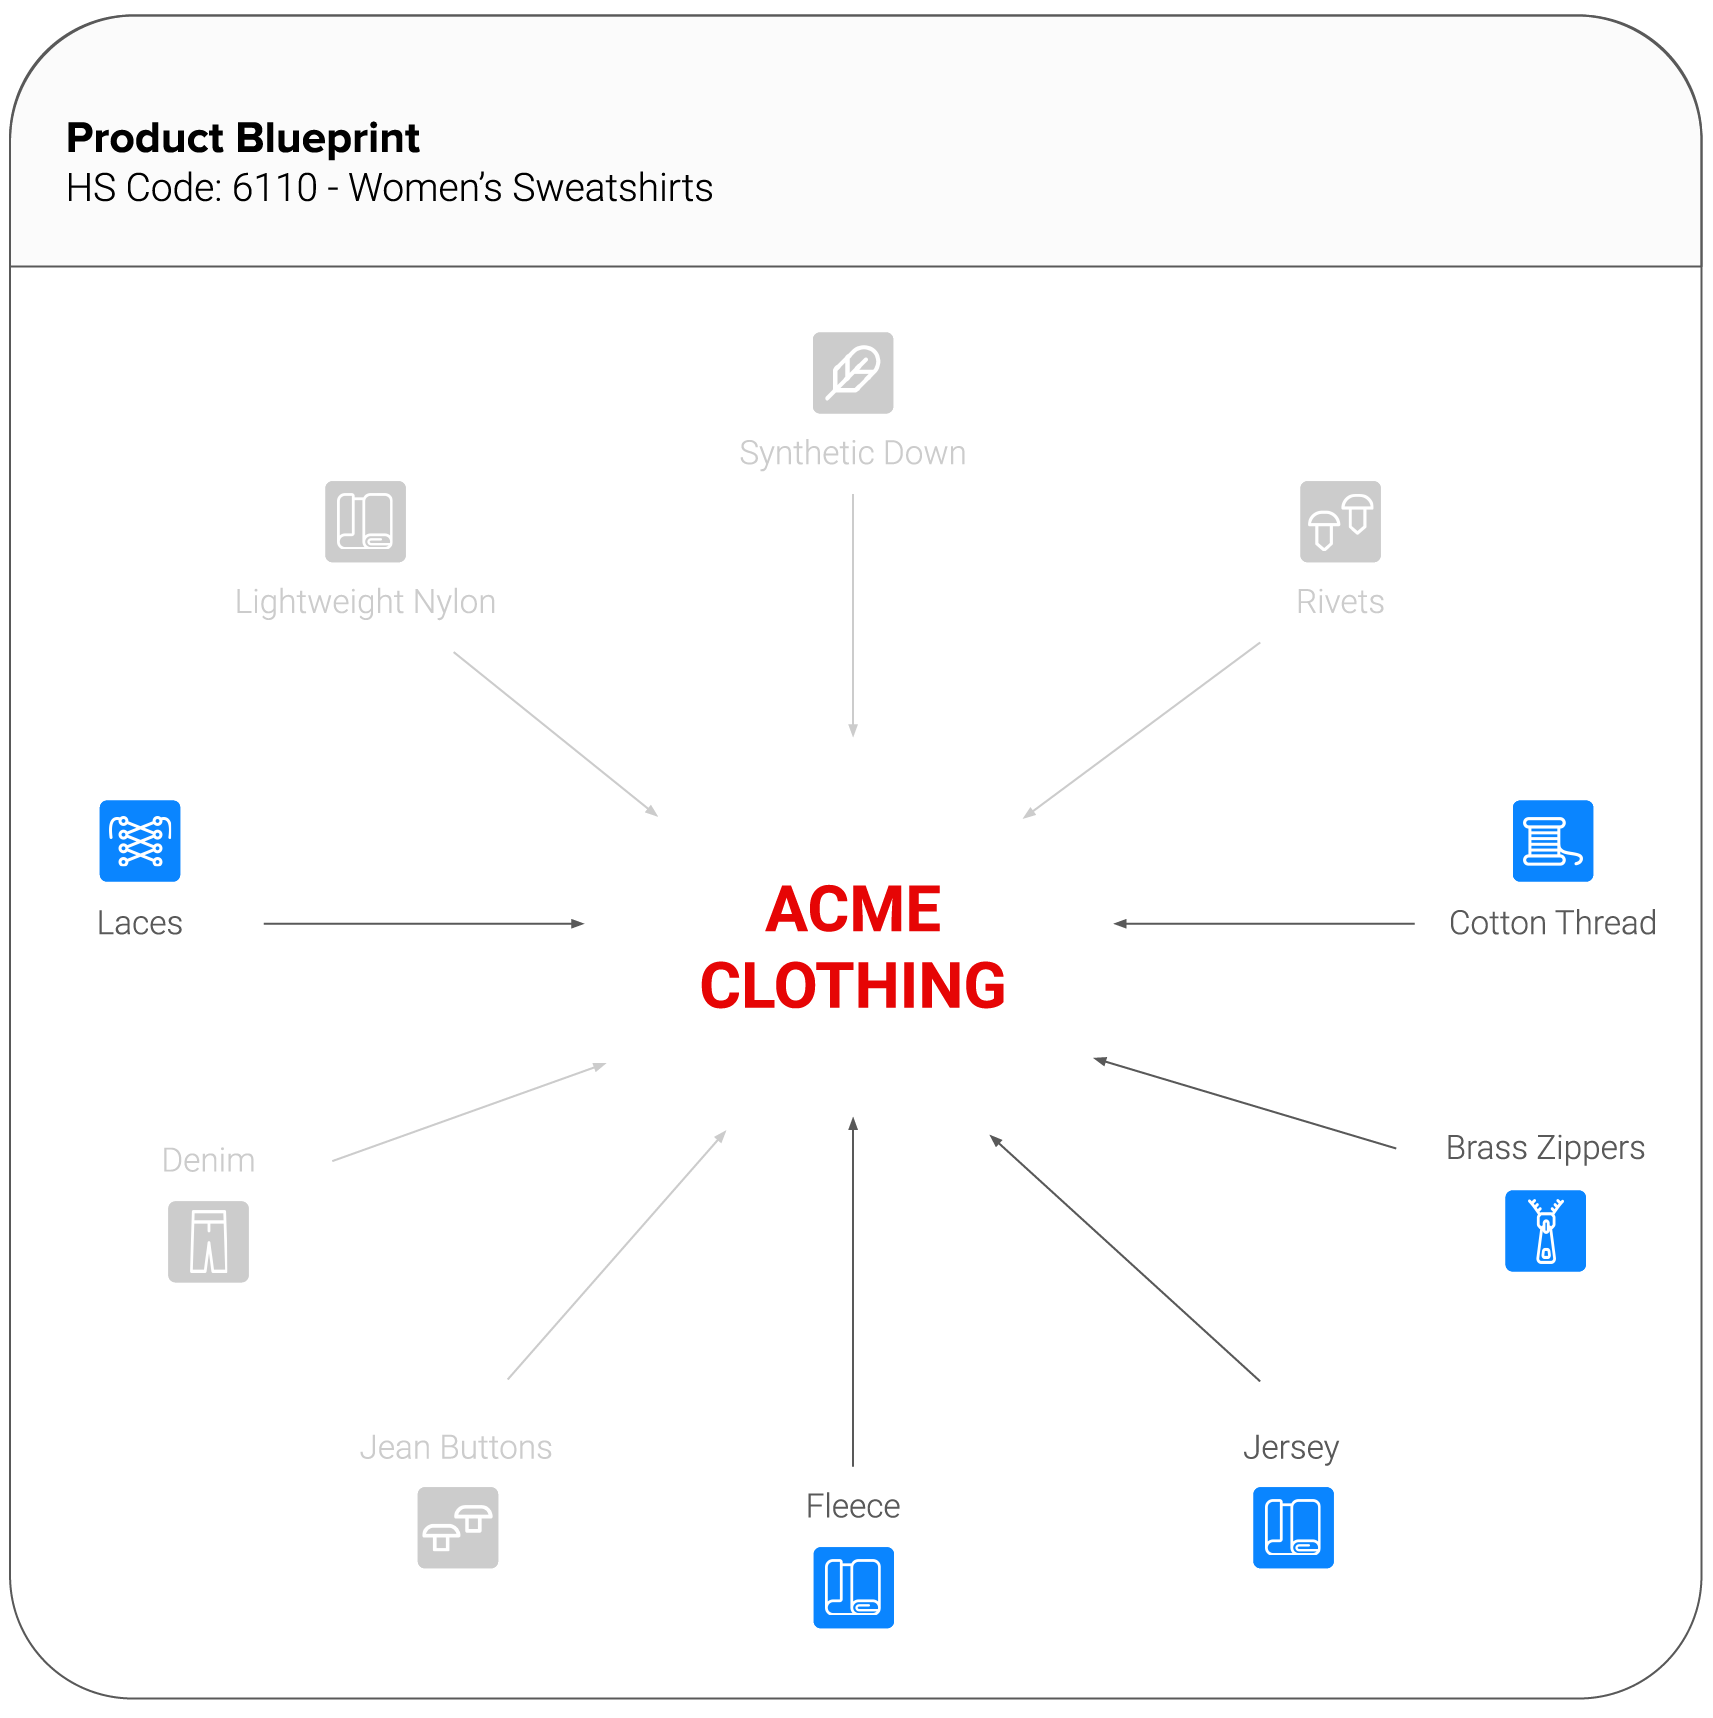
Such targeted insights at these unprecedented speeds are made possible, in part, by a proprietary technology called product blueprints. A product blueprint is a generic bill of materials, built using a large language model, that lists the components likely used in a specific product.
Say, for example, that you’re an apparel company that sources women’s sweatshirts from a manufacturer called Acme Clothing. Acme makes a wide variety of clothes, including men’s jeans and jackets. If you were to generate a supply chain map for Acme Clothing and filter by the HS code for women’s sweatshirts (6110), Sayari Map would isolate only the sub-tier suppliers likely to be involved in the manufacture of that product. Companies supplying rivets, buttons, denim, and synthetic down to Acme would be filtered out thanks to product blueprints (see Fig. 2).
Advanced filtering tools allow you to zero in on high-risk suppliers — or suppliers with risk further upstream in their supply chains — and prioritize those for more resource-intensive due diligence efforts.
In this way, U.S. importers are able to build maximally efficient compliance programs, protecting against complex regulatory risk in a timely and cost-effective manner.
Targeted Automatic Risk Detection with Product Blueprints
Sayari Map accelerates supplier risk prioritization by providing organizations with immediate access to three critical supply chain insights, all of which become increasingly targeted with product blueprint-enabled filters:
- Direct supplier risk.
When a user uploads their list of direct suppliers, Sayari Map instantly matches those suppliers against its market-leading database of entities using analyst-designed entity resolution algorithms. Because the entities in Sayari’s database are pre-screened for 100+ types of risk, users see immediate risk flags associated with their direct suppliers. - Direct suppliers’ upstream risk.
Suppliers without inherent risk may be sourcing from risky entities further upstream in their supply chains. Sayari automatically identifies these risks and maps them to the corresponding direct suppliers. - Suppliers with the greatest risk impact.
Organizations can configure Sayari’s risk insights to match their risk appetite (for example, deactivating irrelevant risk types, changing priorities, and creating custom risk categories). This ensures quick detection of high-impact suppliers relative to specific mandates.
Taken together, these insights dramatically accelerate supply chain risk management timelines by enabling efficient risk prioritization, supporting supplier data collection, and even providing evidentiary support critical to the data validation process.
Case Study: Auto Manufacturer Isolates Critical Risks with Sayari Map
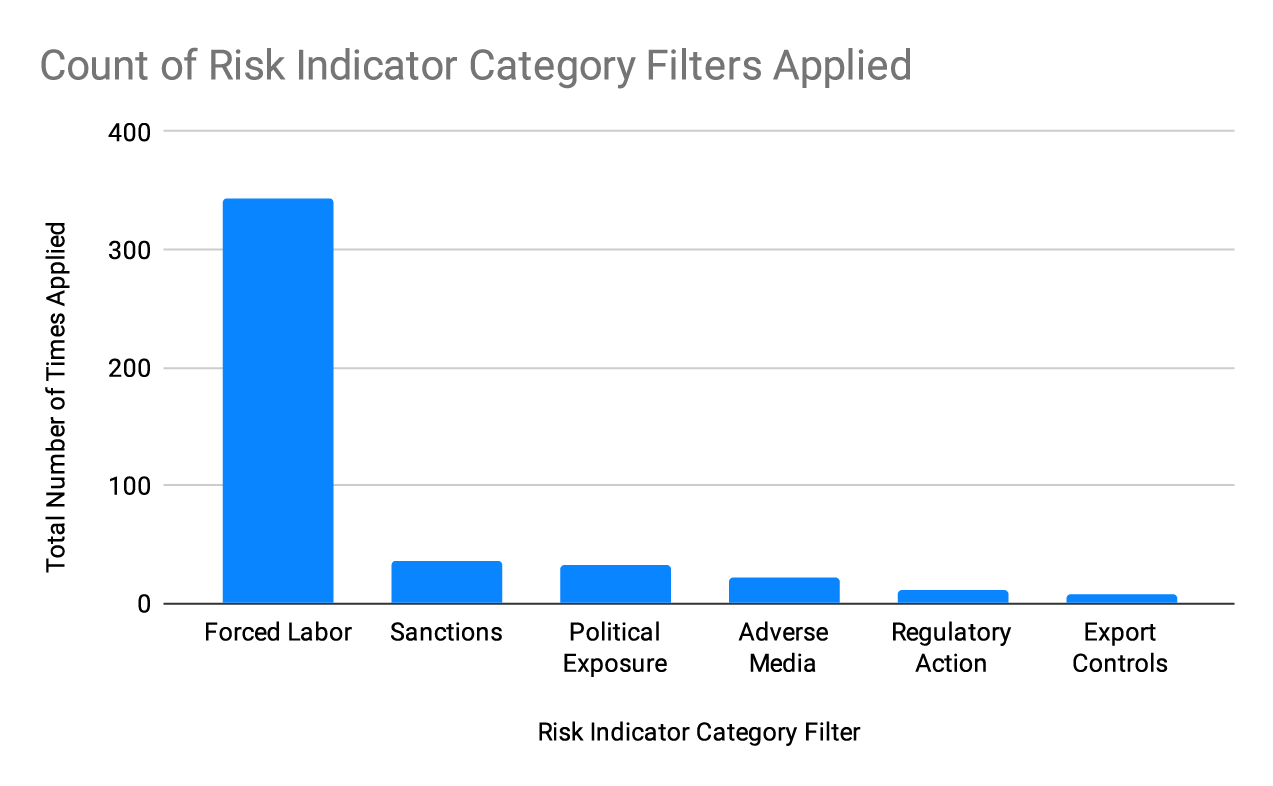
A leading automotive manufacturer used Sayari Map to better assess its upstream supply chain risk and ensure compliance with the UFLPA. After uploading its direct supplier list, the manufacturer filtered the resulting supply chain repeatedly in a variety of combinations over a period of weeks from June to September 2024. The charts below convey how the manufacturer parsed its suppliers in order to optimize its risk mitigation response (See Fig. 3).
The manufacturer applied risk filters over 400 times over the course of the project; 343 were specifically for forced labor. A closer look at the top forced labor filters applied by the manufacturers compliance team reflects a focus on non-obvious risk related to ownership and sub-tier trade.
| Top Forced Labor Indicators | Total Number of Times Applied |
| Owner of Xinjiang-Based Entity | 4 |
| Possibly the Same As (PSA) Sheffield Hallam University Forced Labor Reports Entity | 4 |
| Supplier Network with Entity from Sheffield Hallam University Forced Labor Reports | 2 |
| Owner of Entity from Sheffield Hallam University Forced Labor Reports | 2 |
| Supplier Network with UFLPA Entity | 2 |
| Related to Entity from Sheffield Hallam University Forced Labor Reports | 2 |
| Supplier Network with ASPI Entity | 2 |
| Supplier Network with Xinjiang-Based Entity | 2 |
| Supplier Network with WRO Entity | 2 |
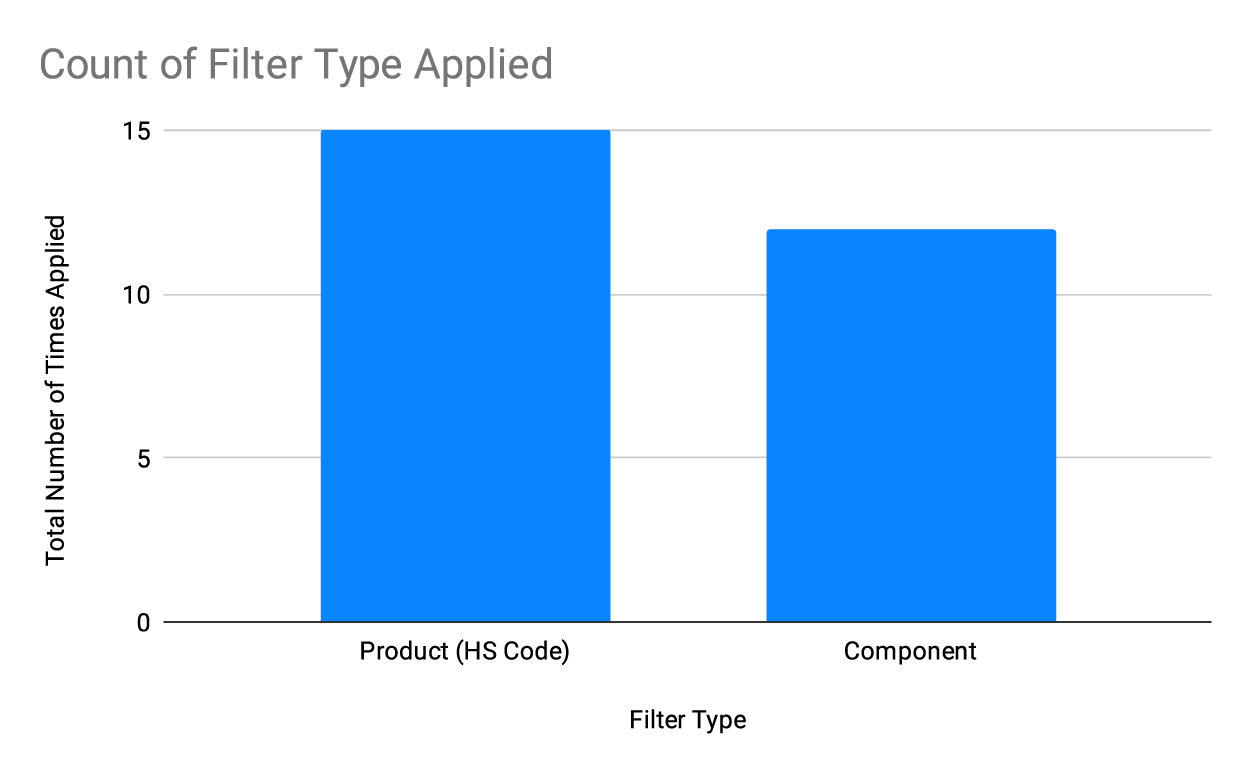
The manufacturer applied other types of ancillary filters to rendered supply chain maps, specifically product and component filters, suggesting an attempt to isolate the most relevant sub-tier suppliers (See Fig. 4).
By drilling down into specific forced labor risks, the automotive manufacturer more efficiently and effectively targeted high-impact suppliers, informed their document collection efforts, and aided in supplier data validation — ultimately doing more to mitigate risk to the company.
Timely, Confident Risk Detection
By supplying corporations with instant access to highly targeted supplier risk data, Sayari Map enables compliance teams to optimize their supplier due diligence programs and keep pace with mounting regulatory pressures.
Sayari Map’s outside-in approach to supply chain intelligence helps companies more effectively prioritize their supplier risk and optimize lines of inquiry during the supplier assessment process. Not only that, but its records, backed by court-admissible documentation, assists in the supplier data validation process as well.
Sayari Map also enables users to monitor suppliers for changes in risk status. Trade data is updated monthly, so if a supplier’s purchases change from one month to the next, any resulting change in trade risk will be reflected in the platform. All users in the organization will be notified of the change so that they can respond accordingly and in concert.
Through automation, Sayari Map greatly accelerates the supply chain risk management process, enabling importers to quickly identify suppliers of concern and focus their investigative resources on those. Third-party audits, questionnaires, and site visits remain necessary, but Sayari Map ensures that teams managing hundreds or thousands of supplier relationships can deploy these more labor-intensive tools confidently and efficiently.
The burden of proof is on U.S. importers to demonstrate compliance down to the raw material. Automated risk detection platforms like Sayari Map protect multinational corporations from regulatory risk and enforcement actions by optimizing human resources in an era of complex global supply chains.
Use Sayari Map to save resources and effectively protect against supply chain risk.

About Sayari
Sayari is the counterparty and supply chain risk intelligence provider trusted by government agencies, multinational corporations, and financial institutions. Its intuitive network analysis platform surfaces hidden risk through integrated corporate ownership, supply chain, trade transaction and risk intelligence data from over 250 jurisdictions.
Sayari is headquartered in Washington, D.C., and its solutions are used by thousands of frontline analysts in over 35 countries.