Here at Sayari, we think the best kind of resolution is entity resolution. Since Sayari’s founding in 2015, we’ve been dedicated to empowering investigative teams to conduct better, faster, and more effective investigations and analyses.
The new features in Sayari Graph are designed with an analyst’s day-to-day in mind. With expanded data types and workflow improvements, Sayari Graph revolutionizes the way you investigate.
Here’s what you can look forward to in our latest release:
Close data gaps
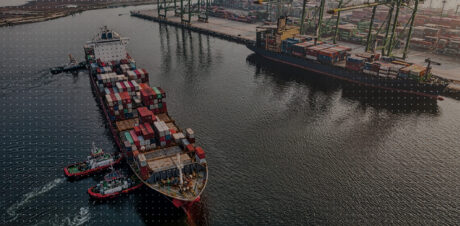
The Sayari global data library is growing! This year, international trade organizations will continue to face increasing pressure to balance constrained supply chains with their trade compliance and vendor risk management. By combining Trade and Maritime Data in Sayari Graph, we are enabling users to derive greater insight into the flow of goods through key international markets. These additions to our data help you to:
- View import and export activity in more than 12 key international markets, including China, Brazil, Colombia, Mexico, Panama, the United States, and Venezuela.
- Uncover vessel characteristics such as ownership, name, IMO number, year of build, and flag for over 150,000 vessels
For more information on Trade Data, learn more here.
Building on past releases, our team has continued to develop and expand Sayari Risk Factors, which are indicators of explicit or suspected risk, from presence on a sanctions list to possible connections to high risk individuals. Confidently assess an entity’s risk with more than 30 Risk Factors and additional risk-relevant information, sourced from existing and enriched risk intelligence data.
For more information and a complete list of Risk Factors, learn more here.
Capitalize on your own insights
We want to enable your teams to discover more. By using Geospatial Search, users can uncover potential targets of interest using their location, rather than searching for a specific entity. A new map view allows you to view results plotted on a map for additional context in your investigations. Users are able to draw an area on a map to narrow searches to their desired locations.
To see Geospatial Search in action, request a live demo.
With the new Data Curation feature in Sayari Graph, users can more quickly make discoveries when all the information they need is in one place. Create new entities, attributes, and relationships – whether proprietary or independently sourced – to centralize your data and unite your team around a single, secure source of truth.
For more information on Data Curation, learn more here.
Create more successful users
In this release, Sayari Graph will be outfitted with an improved Batch Entity Upload feature. This change will allow users to better manage their matches and unresolved entities. And with improved filtering and the ability to create “Possibly Same As” groups, you’ll make connections faster than ever before.
To see Batch Entity Upload in actions, request a live demo.
If you have access to Sayari Graph, you should already have access to these features. If you’re ready to start mapping connections and accelerating your investigations, sign up for a personalized demo of Sayari Graph.


